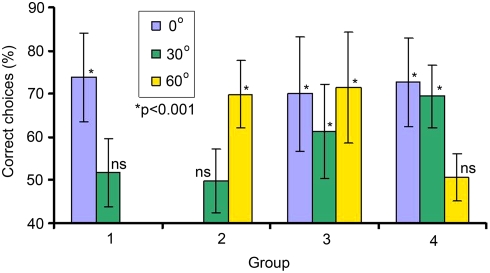
Figure 2. Mean frequency of correct choices (±s.d.) for honeybees recognising images of rotated face stimuli.
Bees in Groups 1 and 2 could not recognise a novel view of the target different from chance performance (50%), but bees in Group 3 could recognise a novel 30° view (by interpolating 0° and 60° images). Bees in Group 4 could not recognise a novel presentation of 60° by extrapolating from learnt 0° and 30° views. For non-significant results (ns) p>0.35.

