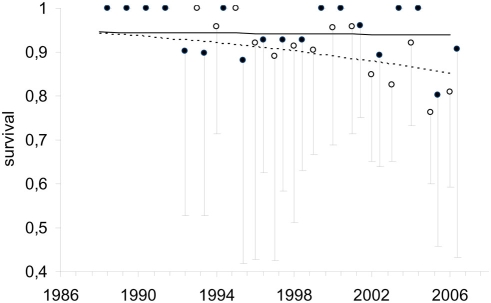
Figure 2. Variation in survival rates of adult (>5y and older; open dots) and young birds (4y and younger; solid dots) with time and age using the parameters obtained with the model [φ(1_4+5)+T, pA].
Mean values and 95% lower confidence intervals are shown, as well as the linear negative trends for adults (dashed line) and young (solid line). Survival rates estimated as 1 were actually estimable parameters, i.e. years in which all individuals survived. Note that the two trends were parallel in the logit scale.

