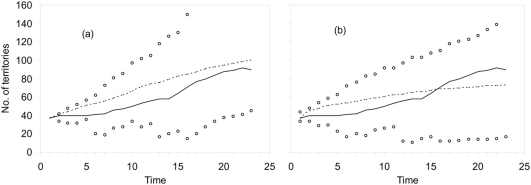
Figure 4. Retrospective analysis of the dynamics of the Spanish population of bearded vultures in the Pyrenees during 1985–2007.
Simulations were carried out using estimated values of (a) actual survival rates, i.e. with the effects of poison and AFS; and (b) survival with poison effects but without AFS. Dashed lines show the mean value of stochastic trajectories using Monte Carlo simulations, while open dots are the maximum and minimum values of that run. For comparison, we show the observed number of breeding territories through time (solid lines).

