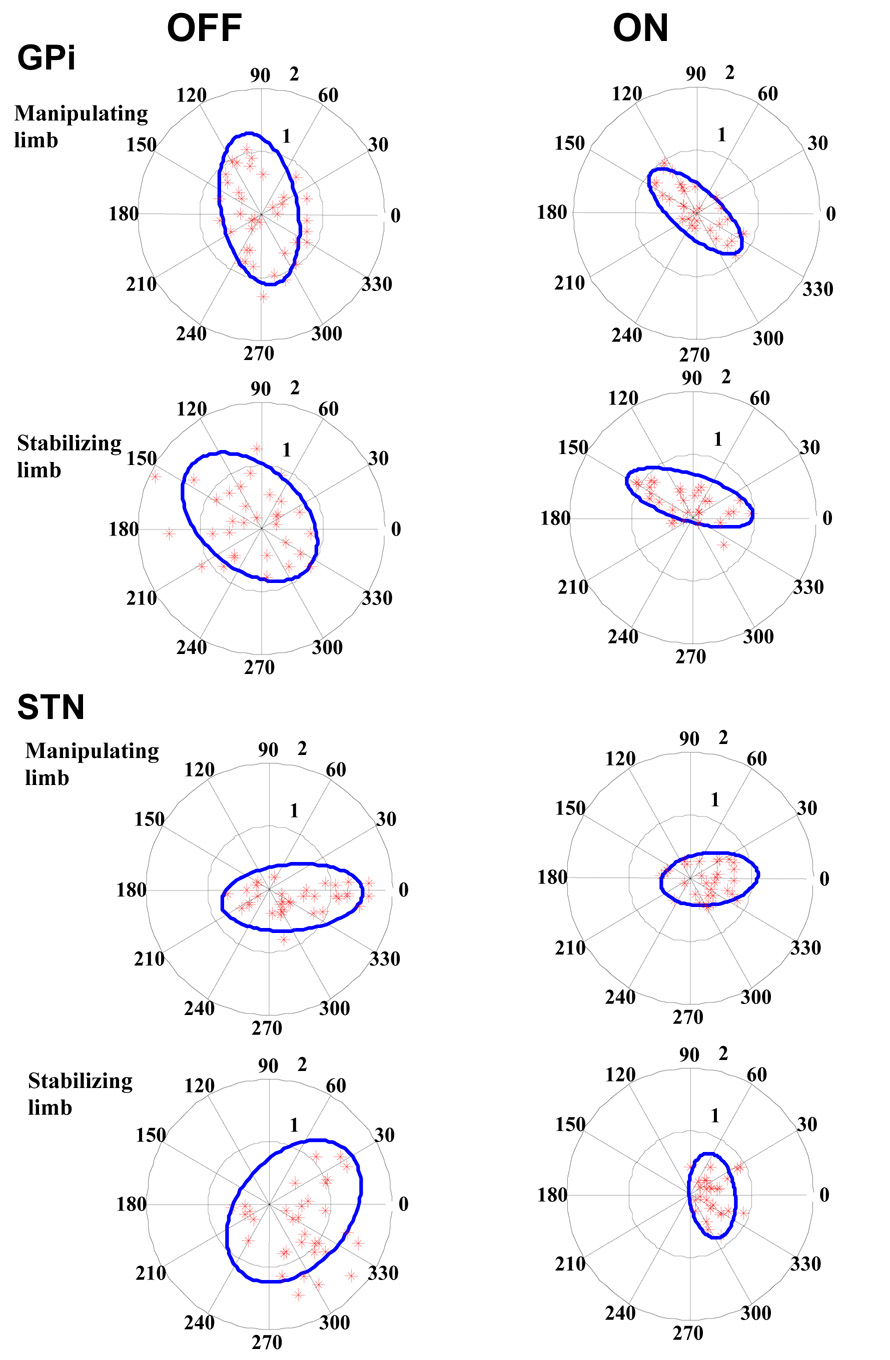
Figure 4.
Center of pressure (COP) values for all bimanual dexterity trials for both groups while Off and On DBS. The object area, outer circle of radius 2 cm, is divided into sectors of 30 degrees (dotted lines) in counter clock wise direction. The inner circle (gray dotted line) indicates the sub area of 1 cm radius. COP data is represented by stars and the solid ellipse defines the area of the spread to encompass 95 percent of the data.

