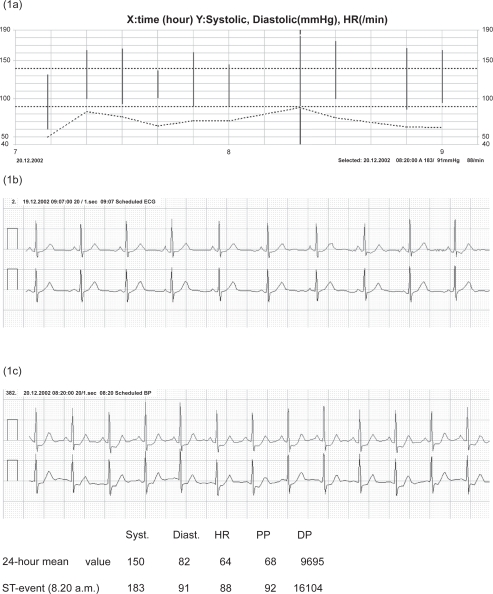
Figure 1.
An excerpt from the 24-hour daily profile of a patient with poorly controlled isolated systolic arterial hypertension (the black bars show the systolic and diastolic blood pressure values and the cross-hatched curve shows the heart rate) (a). Electrocardiogram (ECG) lines with two independent bipolar leads at the beginning of the CardioTens monitoring (b). The ECG unit registered an ST depression episode at 8.20 a.m. that complied with the 1-1-1 rule (c). This triggered an additional blood pressure measurement by the 24-h ambulatory blood pressure measuring unit of the device (marked with a bar in a). The systolic (syst.), diastolic (diast.) blood pressure, pulse pressure (PP) mmHg, heart rate (HR) 1/minute, and double product (DP) mmHg/minute in the ST event are compared with the 24-h means table.

