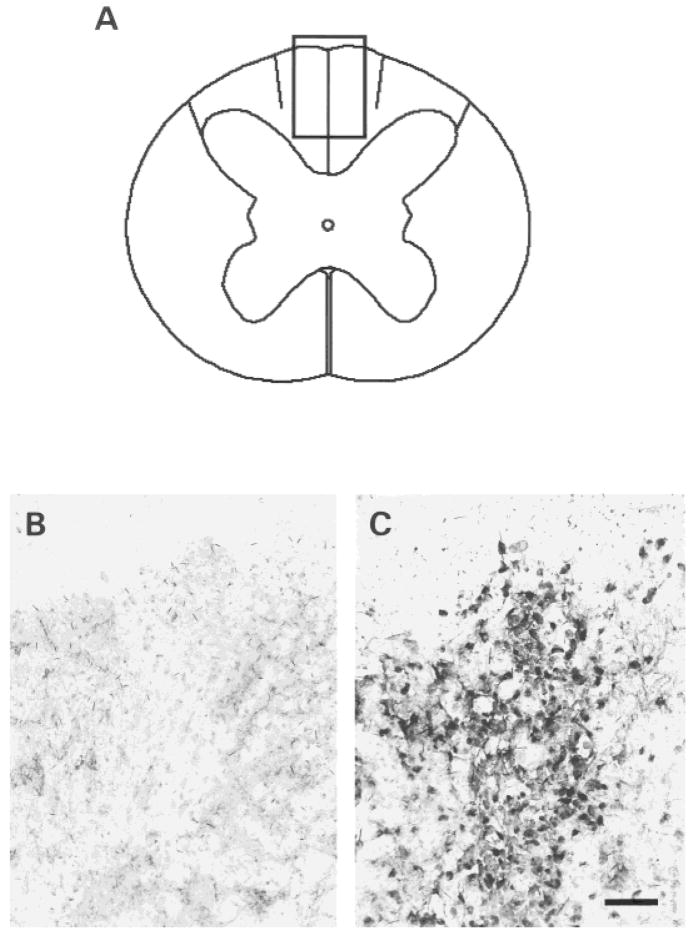
Fig. 6.
A–C: Schematic representation (A) of a lesion achieved by using X-irradiation and ethidium bromide injection (EB-X lesion). The boxed area is shown in (B) and (C) after in situ hybridization for the human-specific COT-1 DNA probe. The transplanted human OECs are labeled markedly in the EB-X lesion (C), whereas the transplanted rat OECs in the lesion are not labeled (B). Scale bar = 50 μm.

