Fig. 4.
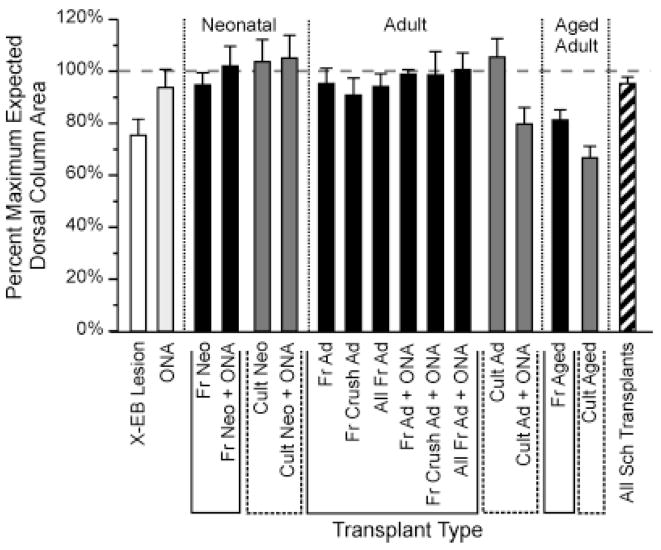
Bar graph illustrating the effects of X-EB lesions and Schwann cell transplantation on local dorsal column expansion or contraction. Each bar represents the average value for the ratio of the maximum cross-sectional of the dorsal column in the experimental condition compared with that of the intact control dorsal column. White and light gray bars represent control lesions without cell transplantation and control ONA transplants. Solid black and dark gray bars represent transplant protocols using freshly isolated and cultured cells, respectively. Diagonally striped bar represents all Schwann cell transplantation experiments in this study. Vertical dotted lines above the ordinate demarcate groups of protocols using Schwann cells from neonatal (Neo), adult (Ad), or aged adult (Aged) donors, respectively. Solid and dashed lines below the X-axis bracket groups of transplant protocols using freshly isolated (Fr) and cultured (Cult) cells, respectively. N values from left to right were 8, 3, 3, 5,10, 8, 17, 5, 22, 2, 5, 7, 2, 6, 5, 2, and 70, respectively. Labeling conventions and N values also apply to Figures 6 and 7 (see also Table 1). Note that although dorsal column sizes were increased under cell transplantation protocols when compared with X-EB lesions alone, significant expansions of dorsal columns beyond sizes found in intact control animals were rare. Maximal cross-sectional areas for all Schwann cell-transplanted conditions differed significantly from X-EB lesions alone at P < 0.006. Cross-sectional areas of dorsal columns receiving transplants of freshly isolated neonatal Schwann cells alone, freshly isolated neonatal Schwann cells + ONAs, cultured neonatal Schwann cells, freshly isolated adult Schwann cells alone, and freshly isolated adult Schwann cells + ONAs each differed from X-EB lesions alone at P < 0.02 or better (unpaired Student’s t-test). For other abbreviations, see list.

