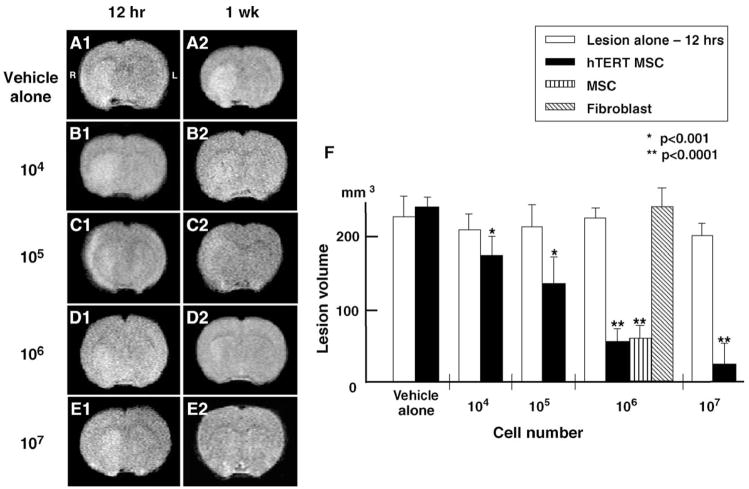
Fig. 2.
Evaluation of the ischemic lesion volume with MRI. T2-weighted images were obtained from experimental animals 12 h after MCAO and 1 week after intravenous delivery of varying concentrations of hTERT-MSCs. The left-hand column (panels A1–E1) shows single brain images obtained 12 h post injury. The right hand column (panels A2–E2) show images 1 week after treatment. Panel F indicates summary of the lesion volumes in each group.

