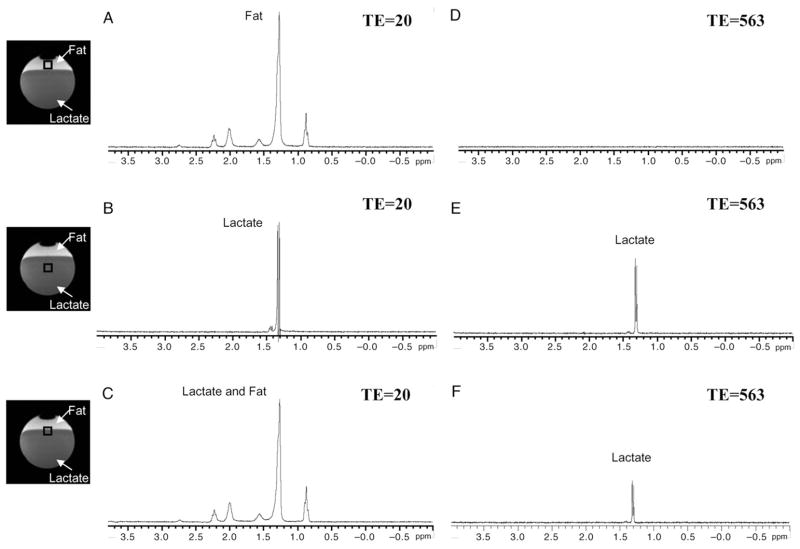
Fig. 2.
Proton MR spectra from the fat (A, D), the lactate (B, E), and border zone (C, F) in the spherical phantom. Frequency of signal acquired from fat is overlapped with lactate when TE is set as short (20 ms) (C). However, signal of fat disappeared and only lactate signal became obvious when TE was set as longer (563 ms) (F).

