Fig. 4.
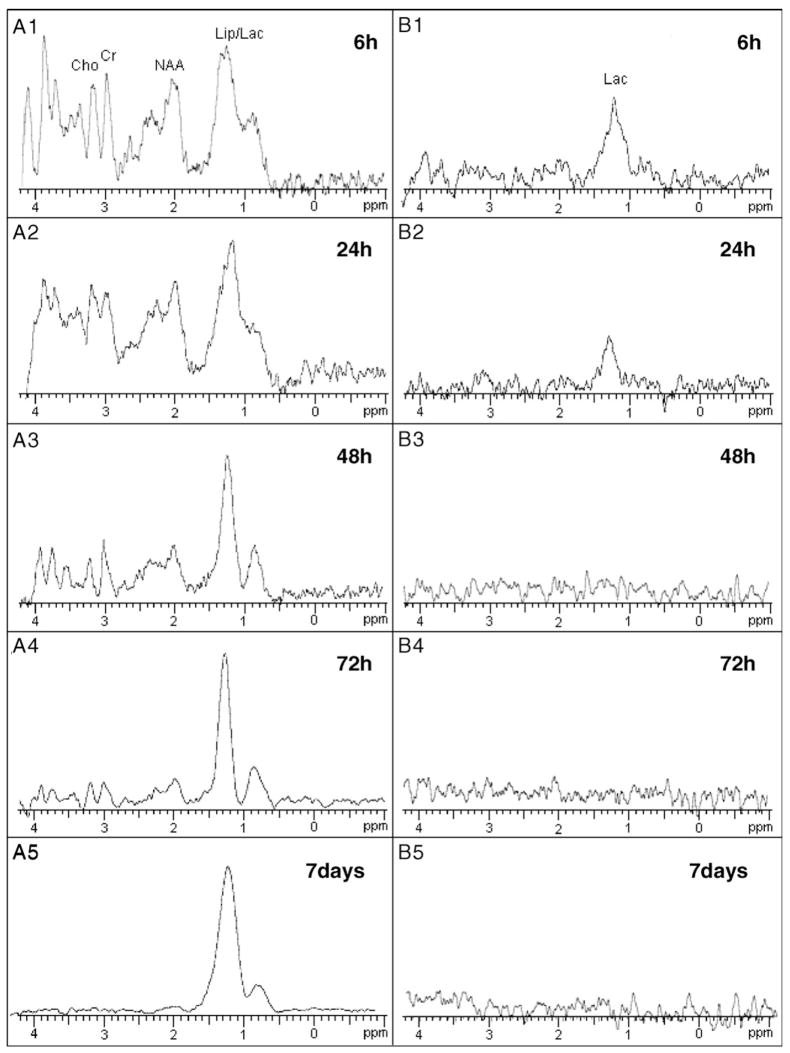
In vivo proton MR spectra with short TE (20 ms) of ischemic brain lesions at 6 (A1), 24 (A2), 48 (A3), 72 h (A4), and 7 days (A5) after MCAO. Lactate signal was overlapped with lipid, which was detected 6 h after MCAO, and gradually increased over the time course of 7 days. Lactate signals were isolated with longer TE (563 ms) (B1–5), and were obvious only 6 and 24 h after MCAO (B1 and B2, respectively).

