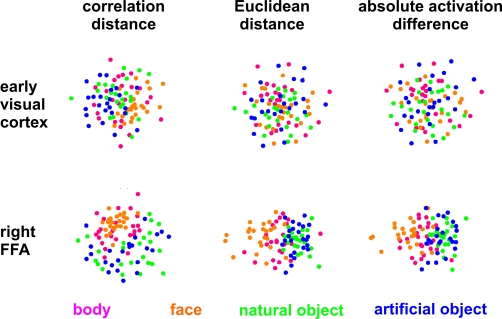
Figure 4.
Unsupervised arrangement of 96 experimental conditions reflecting pairwise activity-pattern similarity. As in Figure 1, but for 96 instead of 4 conditions, the arrangements reflect the activity-pattern similarity structure. Each panel visualizes the RDM from the corresponding panel in Figure 10. Each condition (corresponding to the presentation of one of 96 object images) is represented by a colored dot, where the color codes for the category (legend at the bottom). In each panel, dots placed close together indicate that the two conditions were associated with similar activity patterns. Dots placed far apart indicate that the two conditions were associated with dissimilar activity patterns. The panels show results of non-metric multidimensional scaling (minimizing the loss function “stress”) for two brain regions (rows) and three activity-pattern dissimilarity measures (columns). Note that a categorical clustering of the face-image response patterns is apparent in the right FFA (bottom row), but not in early visual cortex (top row). (Note that the absolute activation differences could be represented by an arrangement along a straight line, had the dissimilarity matrices not been averaged across subjects.)

