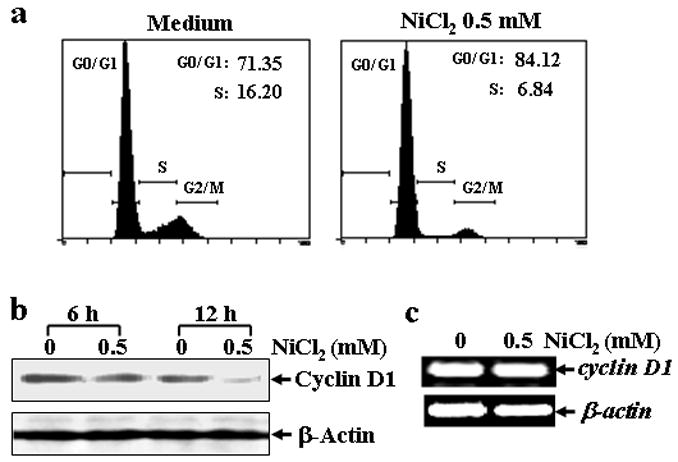
Fig. 4. Cell cycle arrest and cyclin D1 degradation induced by NiCl2 in MEFs.

(a), MEFs were seeded into each well of a 6-well plates and cultured in DMEM containing 10% FBS at 37°C overnight. After the cell density reached 70–80%, the cells were exposed to 0.5 mM NiCl2 for 36 hrs, and then fixed and stained with propidium iodide. The cell cycle distribution was determined by flow cytometry. The data presented in this figure indicating the percentage of G0/G1 and S phases was one representative of three independent experiments. (b and c), MEFs were seeded into each well of 6-well plates, and cultured at 37°C overnight. The cells were treated with 0.5 mM NiCl2 for 6 or 12 hrs, washed once with ice-cold PBS and then extracted with SDS-sample buffer. The cyclin D1 protein levels in the extracts were analyzed by Western blot (b). The cells were treated with 0.5 mM NiCl2 for 12 hrs, and then extracted with Trizol reagent for the total RNA isolation. Cyclin D1 was amplified (c).
