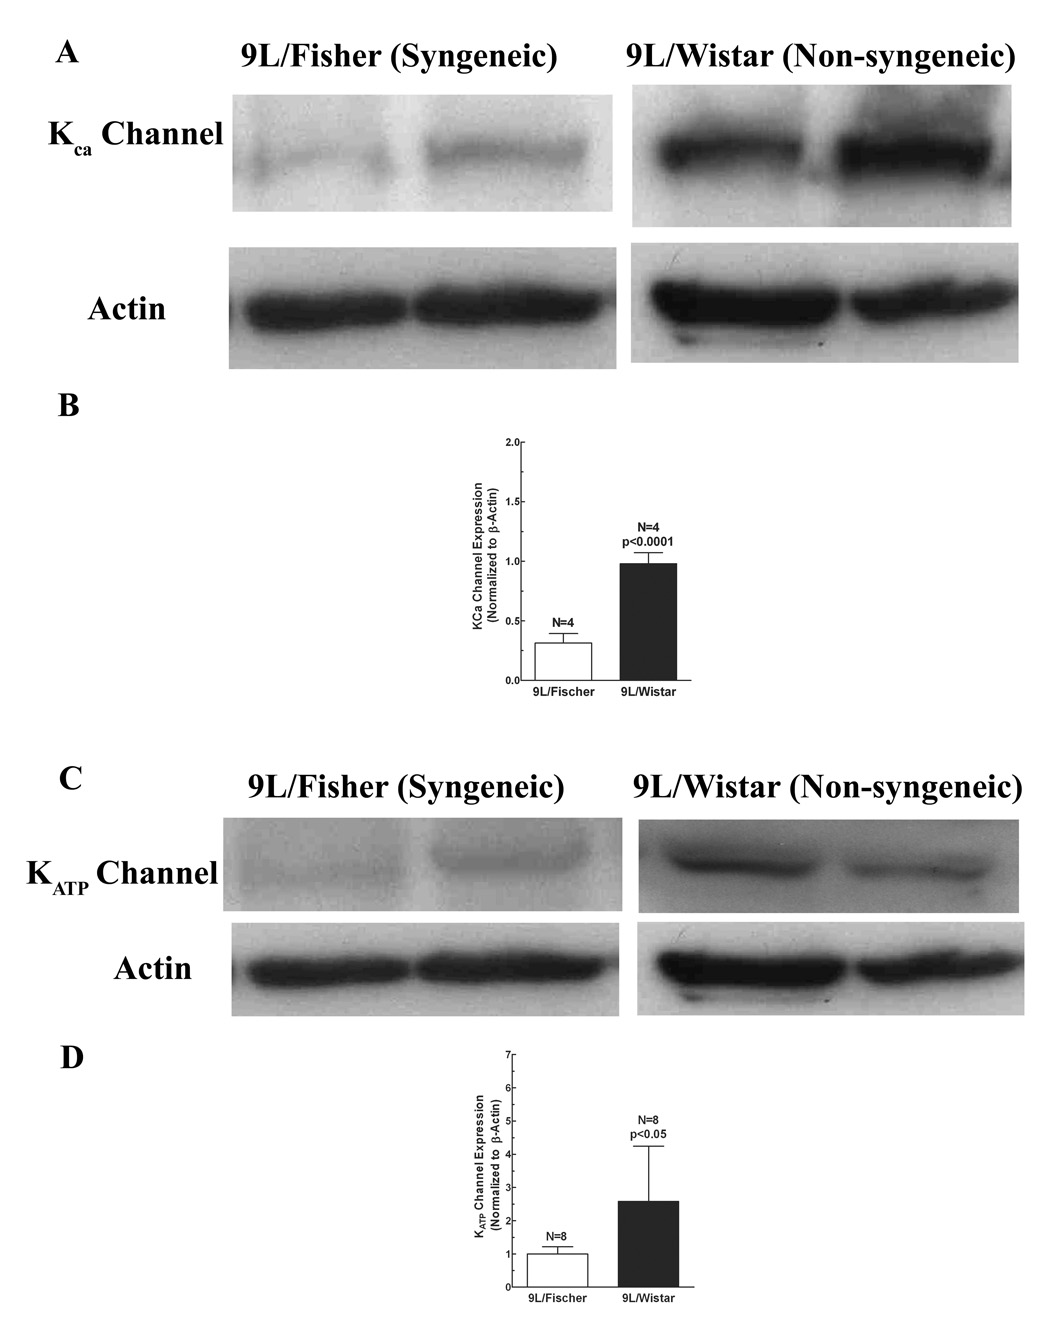
Figure 5. Protein levels of potassium channels (KATP and Kca) in 9L tumor tissue from different models (Wistar and Fisher rats).
The protein levels of potassium channels and actin (internal standard) cells were determined by Western blot analysis. A, Representative immunoblots of KATP channel in 9L/Wistar and 9L/Fischer; B, quantitative analysis of KATP channel protein in 9L/Wistar and 9L/Fischer; C, Representative immunoblots of KCa channel in 9L/Wistar and 9L/Fischer; D, quantitative analysis of KCa channel protein in 9L/Wistar and 9L/Fischer.

