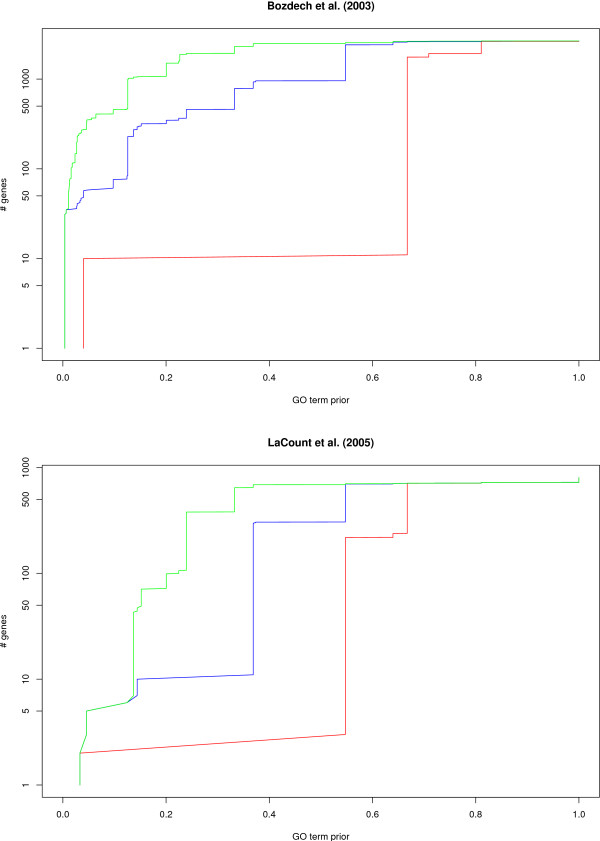
Figure 8.
Estimate of the amount of new information supplied by the transcriptomic data source of Bozdech et al. (2003) [27] and the interactomic data source of LaCount et al. (2005) [33]. Red, blue and green lines represent the results achieved with TDR thresholds of 75%, 50% and 25%, respectively. The x-axis gives the prior probabilities of the terms, while the y-axis (in log scale) reports the number of uncharacterized genes in the ontology that have been predicted with a TDR above the threshold, on a GO term with prior probability below x.

