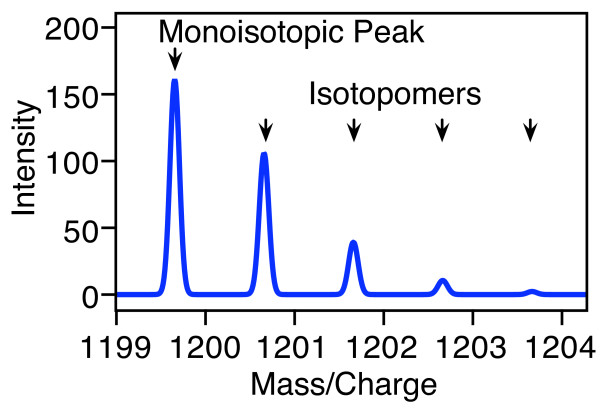
Figure 1.
A calculated isotope distribution. The mass spectrum of a peptide or oligonucleotide consists of a statistical distribution of peaks that arises from the natural abundance of heavy isotopes. The calculated spectrum of the unlabeled peptide NVLPQRSTVW shown here consists of a monoisotopic peak at the lowest mass/charge value, and several additional peaks at higher mass/charge values. These additional peaks are heavy isotopomers that result from the natural abundance isotopes.

