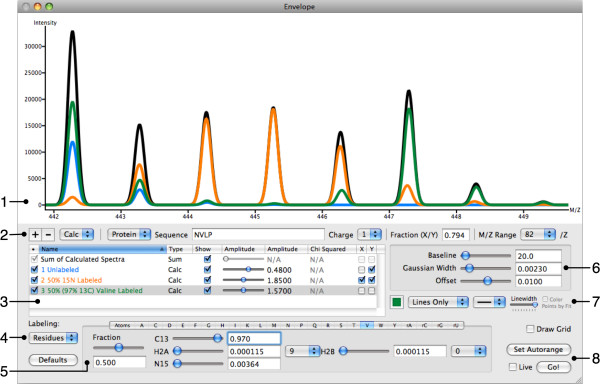
Figure 2.
The Envelope user interface. (1) The main display for isotope distributions. Users can zoom (click and drag), move the display (control-clicking and drag), or reset the zoom level (double-click). (2) Add or remove spectra with the "+" and "-" buttons. A drop down menu selects for protein or RNA, and controls define both sequence and charge. "Fraction" is a user-defined quantity determined by the amplitudes of selected calculated spectra. The M/Z Range menu allows the user to specify a greater mass range for large peptides. (3) A list of all spectra, each with controls to hide or display its trace and adjust its amplitude. By deselecting the checkbox in the leftmost column (•), calculated spectra are disabled. The fraction from (2) is defined here via checkboxes X and Y, and chi-squared is displayed for experimental data. (4) Choose between unlabeled, atom-based labeling, or residue-based labeling for the species currently selected in (3). (5) Define the labeling pattern for the species currently selected in (3). Displayed is the definition for valine (residue-based labeling), which is 50% labeled with 97% 13C. For individual residues the amount of 13C or 15N can be specified, as well as the fraction of the residue that is labeled. Two different 2H values can be defined and applied to a subset of the residue's hydrogen atoms to account for hydrogen exchange. Hydrogens beyond those two groups are assumed to have natural abundance. (6) Global adjustments for baseline, Gaussian width and offset. These apply to all calculated spectra and can be adjusted to fit experimental data. (7) Change the appearance of traces. (8) Initiate calculation of spectra or auto-zoom. If the "Live" checkbox is selected, spectra will automatically update in response to user-initiated changes. Displayed are species for the peptide NVLP; unlabeled (blue), 50% 15N labeled (orange) and containing 50% labeled valine, itself 97% 13C labeled. The sum of these species is displayed in black.

