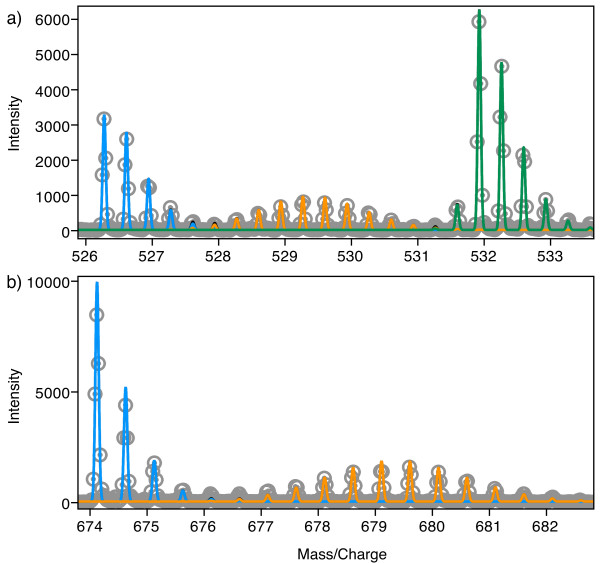
Figure 3.
Atom-based labeling with 15N. a) The mass spectrum for ribosomal protein S2, residues 45–58 (TVPMFNEALAELNK, z = +3). Experimental data points are shown as grey circles with centered dots. The calculated unlabeled isotope distribution is shown in blue, the partially labeled distribution (50% 15N) shown in orange, and the fully labeled distribution (99.3% 15N) shown in green. b) The isotope distribution for the 16S RNA, nucleotides 766–769 (AAAG, z = -2). Experimental data points are shown as grey circles with centered dots. The calculated unlabeled isotope distribution is shown in blue and the partially labeled (50% 15N) distribution is shown in orange. In both cases, the different labeled species were fit by hand to match the experimental data using Envelope, and the figures were directly exported from Envelope. The data used is available for download (Additional file 3).

