Figure 6.
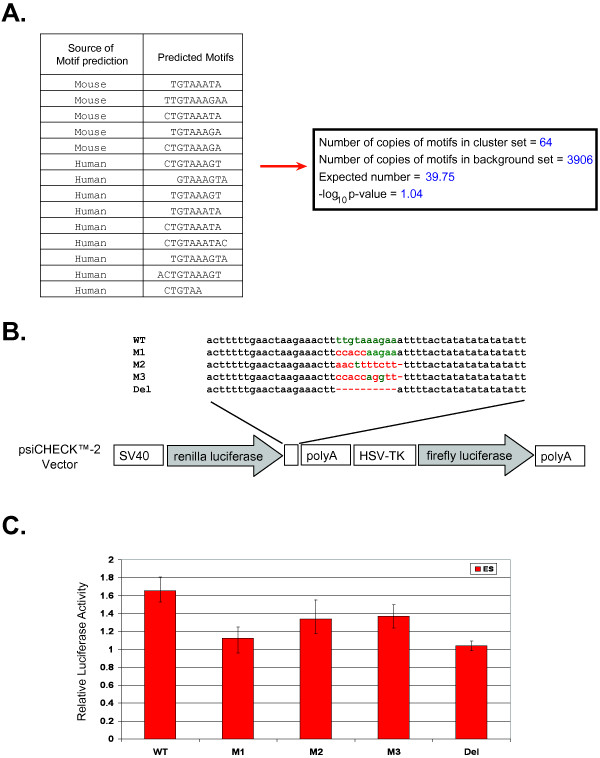
Experimental validation of regulatory site found in 3' UTR of embryonic stem cell analysis. (A) Table shows the sequence source of the motifs in the motif cluster. The right box shows the Bonferroni corrected -log10 p-value of the motif cluster in the 3' UTR sequences calculated as described in Figure 4A. (B) Schematic representation of reporter constructs used in study. Constructs contain either the predicted motif, which occurs in the 3' UTR of n-myc and depicted in green (WT), the mutated motif (M1, M2, M3), or a deletion of the motif (Del). Red nucleotides represent mutations and dashes represent deletions. (C) Regulatory activity of predicted motif in mouse ES cells. Constructs described in (B) were transfected in mouse ES cells. After 14–18 hours, cells were lysed and assayed for luciferase activity. The ratio of Renilla to Firefly luciferase was taken for each experiment. Each experiment was done in triplicate, except M3 which was done in duplicate, and the ratios were averaged. The average values were then normalized to the activity of the empty construct. Bars represent the averages of the normalized values with error bars indicating the range.

