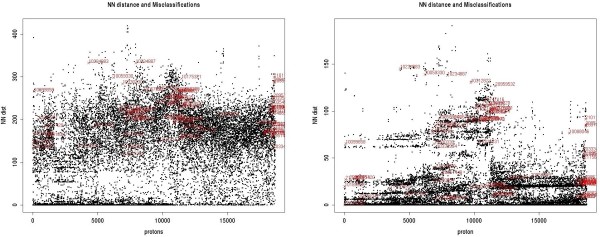
Figure 11.
Effect of feature selection on quality of prediction. Protons in black are those correctly classified by at least one classifier, the misclassified protons ('hard errors') are shown in red with the corresponding atomID. Left: unreduced descriptor set. Right: reduced descriptor set after feature selection. The protons are sorted increasingly according to the shift value [0..10.7] ppm. On the y-axis the Manhattan distance to the nearest neighbour (NN) proton in the numeric descriptor space is shown.

