
Figure 6.
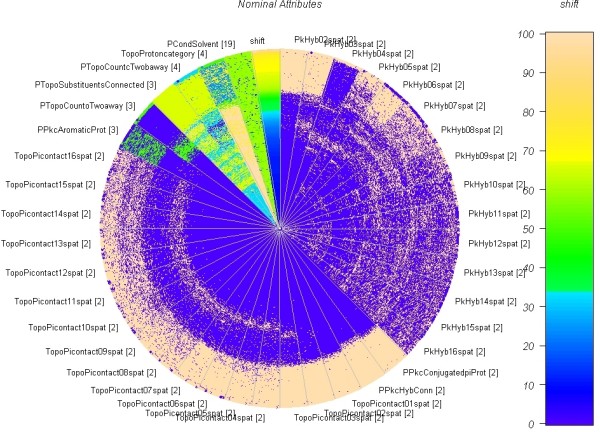
Circle Segments Plot of the categorial attributes in the descriptor set. The values in each of the segments are sorted increasingly according to the shift from the inner of the circle to the outer. The chemical shift in the range [0..10.7] is mapped to the coloured interval of size [0..100]. The number of the distinct attribute levels i is given in square brackets. Those values are mapped to the colour map as i/max(i) * 100. The influence of the dichotomous spatial variables PkHyb* and TopoPicontact* are less amenable with respect to the chemical shift, the farther the respective heavy atom is.