
Fig. 5.
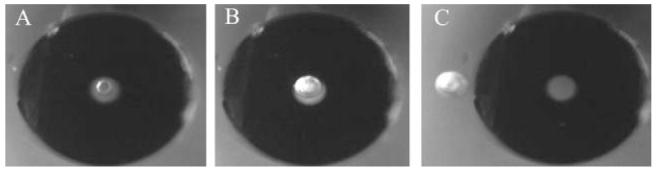
Images of a capillary over a cell in a trap. (A) Before cell lysis. A cell marked by the small arrow is centered beneath the lumen of the capillary. The lumen (50 μm diameter) of the capillary is visualized as the lighter area immediately surrounding the cell. The edge of the outer capillary wall (360 μm diameter) is marked by the large arrow in the lower right hand corner. (B) Image of the capillary and trap in panel shown in (A) but 66 ms after application of a voltage pulse. The cell has been lysed and is no longer present. Instead a gas bubble is seen within in the cell trap. (C) Image of the capillary and trap in panel (B) but the trap has been translocated laterally with respect to the capillary lumen. The arrow marks the gas bubble retained in the trap. The capillary and its lumen are seen to the right of the trap.