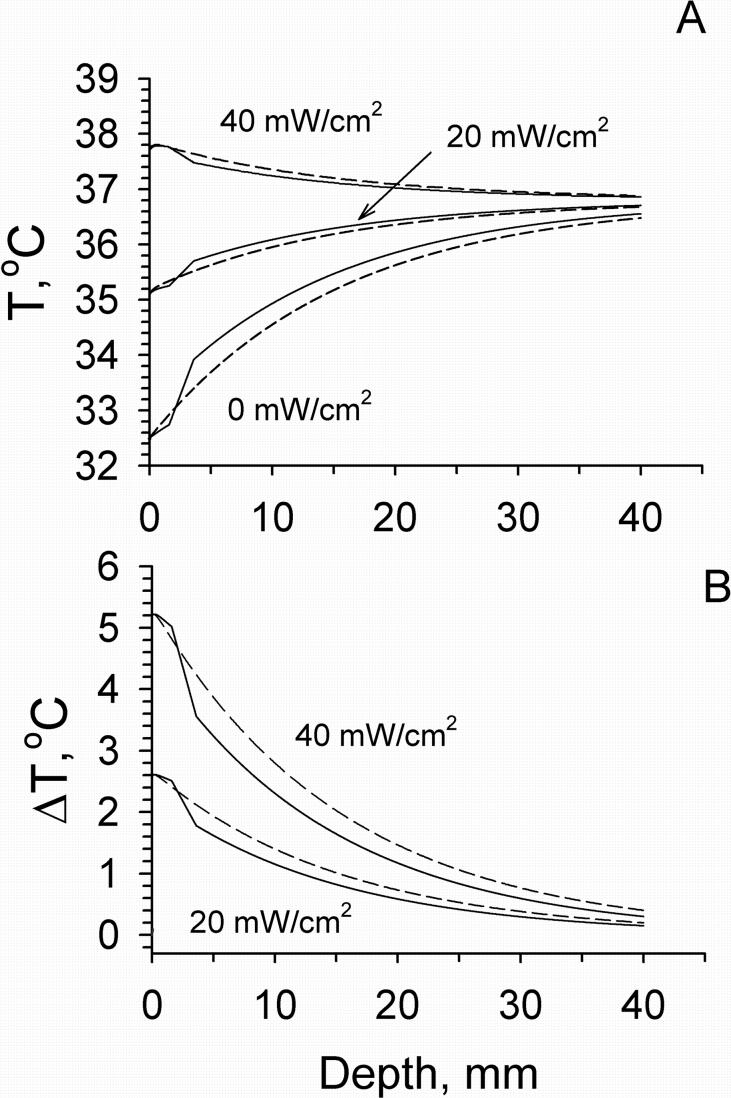
Figure 5.
Temperature (A) and temperature increment (B) distributions within tissue calculated for different mm wave exposure intensities using models M2 (dashed lines) and M4 (solid lines). In M2: Tissue blood flow was 4.57·10−4 ml/s/ml. In M4: Blood flows in the dermis, fat and muscle were constant, equal to their typical values of 1.4·10−3, 0.43·10−5 and 5.33·10−4 ml/s/ml, respectively. The thickness of the fat layer was 2 mm.

