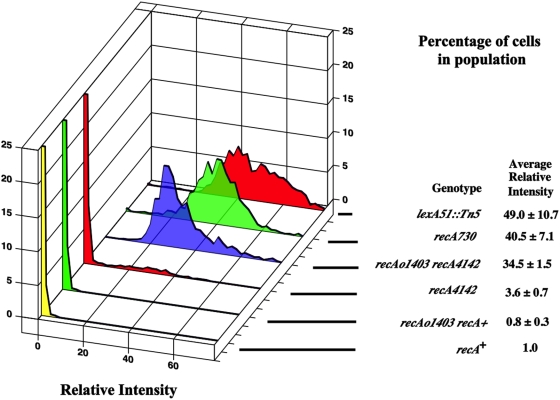
Figure 2. This figure shows the distributions of cells with different levels of constitutive SOS expression (detected as GFP fluorescence) expressed as the percentage of cells in the population.
The graphs truncate the percentage of cells at 25%. The strains are in order from top of the graph to the bottom with the relevant part of the genotype in parentheses. Unless otherwise indicated, all strains were grown in minimal medium at 37°C with aeration. The strains are: SS1408 (lexA51::Tn5), SS4629 (recA730), SS4976 (recAo1403 recA4142), SS6013 (recA4142), SS6088 (recAo1403 recA+) and SS996 (recA +).

