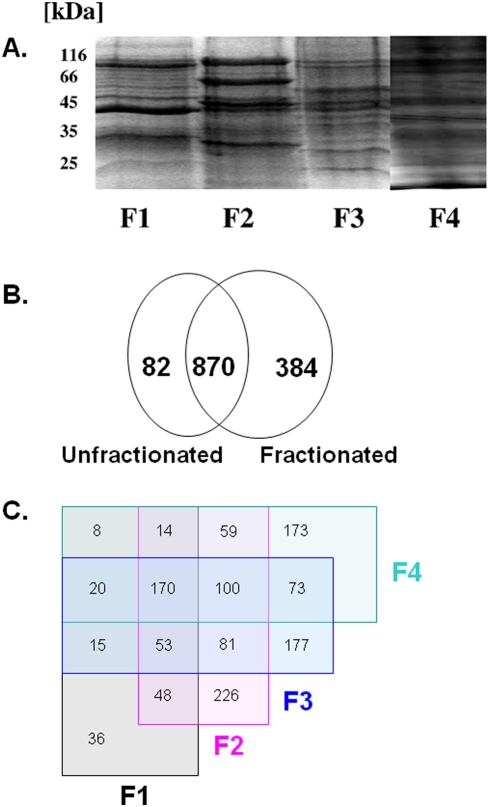
Figure 1. Quantification improvement by fractionation of cell extracts.
A: Fractionation of P. falciparum trophozoite extracts by centrifugation and low-strength anion exchange chromatography. F1 to F3 are fractions derived by separation of the 100.000 g supernatant on low-strength anion exchanger chromatography. F1 (flowthrough); F2 (200 mM NaCl eluate); F3 (500 mM eluate); F4 (100.000 g pellet). The band pattern shows a fractionation into different subproteomes. B: Venn diagram comparing numbers of protein identifications of a previous MudPIT study by Florens et al. [3] and our current study, where prefractionation was applied. C: Venn diagram summarizing numbers of protein identifications per fraction and overlaps with other fractions.

