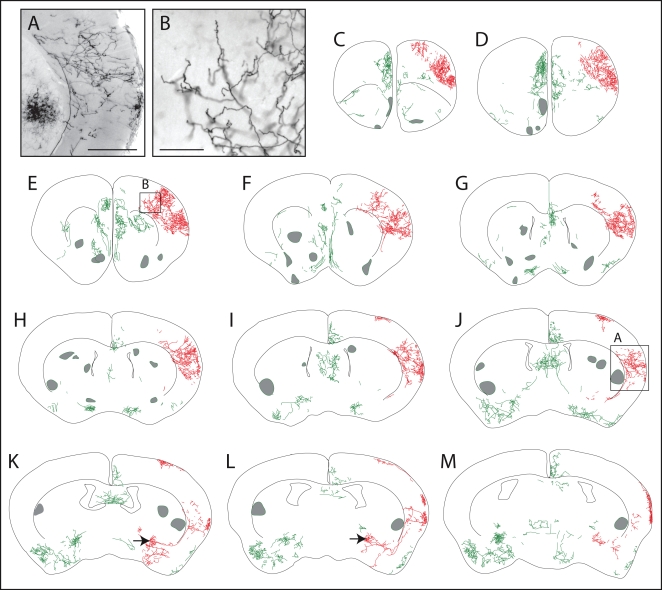
Figure 6. Morphologies of AP-labeled neurons in the rostral half of an adult ChAT-IRES-CreER;Z/AP brain.
The mouse received injections of 4HT on P8 (1 mg), P21 (2 mg), and P28 (2 mg). A,B, bright field images of AP-stained tissue corresponding to the boxed regions in J and E, respectively. C–M, AP-labeled processes traced from eleven serial 300 um coronal sections. Two adjacent neurons with cell bodies in the basal forebrain (black arrows in panels K and L) and their large axon arbors in the cerebral cortex are shown in red. All other processes are shown in green. Regions in which a high density of AP-labeled processes precluded accurate tracing are marked by semi-opaque grey zones. Scale bar: 0.5 mm in A, 0.2 mm in B.

