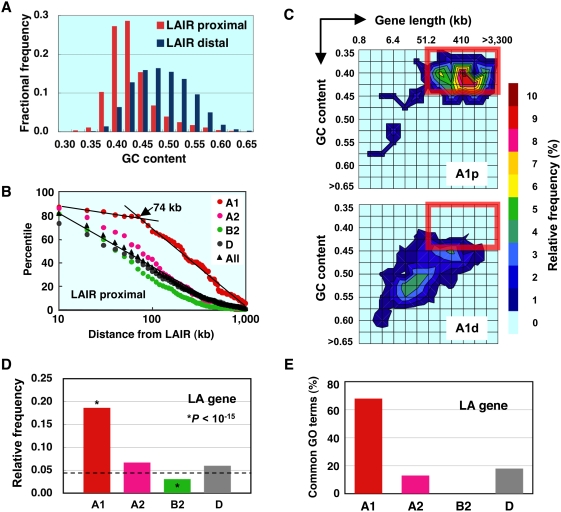
Figure 2. A1 genes occupy a unique position in the genome.
(A) Genes juxtaposed to LAIR (LAIR proximal) are more AT-rich than the rest of the genes (LAIR distal). The difference in overall GC contents between the two groups is highly significant (P<10−15). (B) A considerable proportion of LAIR-proximal A1 genes have a long transcribed region. Percentiles of the LAIR-proximal genes are plotted against the logarithm of distance from the margin of LAIR. (C) Contour maps of frequency distribution for LAIR-proximal (A1p) and LAIR-distal (A1d) A1 genes as a function of logarithmic gene length and GC content. Relative frequency levels are reflected in thermal display. The boxed area represents “long and AT-rich”. (D) Relative frequency of LA genes in various expression groups. The occurrence rate of LA gene in all gene groups (broken line) was used as a reference for chi-squire test. (E) Percentages of GO terms shared between LA gene and various expression groups. Only significant GO terms (P<10−4) overlapping with those of LA genes were counted.

