
Figure 7.
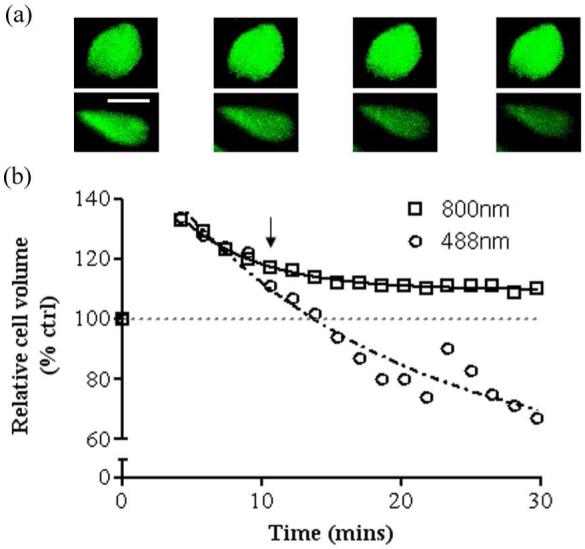
Relative in situ chondrocyte volume following osmotic challenge and subsequent volume recovery, imaged using OPE and TPE. Bovine articular cartilage explants were exposed to a hypo-osmotic challenge (280-180mOsm) and images acquired using 488nm OPE or 800nm TPE (with NDDs). A typical cell from each imaging condition showing near-identical relative swelling, was examined for comparison. (a) Images of in situ, calcein-loaded chondrocytes before, and at 10, 20 and 30mins after hypo-osmotic challenge imaged with either 800nm TPE (upper panels) or 488nm OPE (lower panels). Photo-bleaching was clearly evident in the cell exposed to OPE, whereas the fluorescence of the cell imaged using 800nm TPE remained relatively unchanged. Scale bar = 10μm. (b) The volume of each cell was determined and plotted relative to the initial volume vs time. Hypo-osmotic challenge caused an initial increase in cell volume (≈30%) followed by matched RVD in both cells over the next 3 time points. After the 5th time point (arrow) the 488nm exposed cell appeared to show accelerated RVD compared with TPE. In reality however, the apparent volume decrease was a consequence of rapid calcein bleaching, leading to a poor definition of the membrane edge, resulting in inaccurate volume estimation (see text).