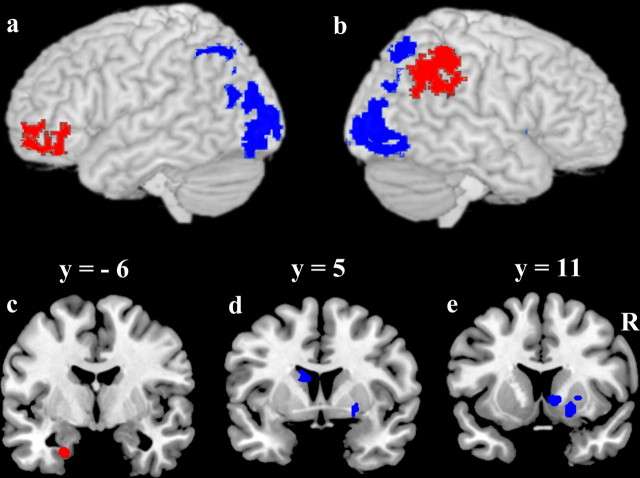
Figure 3.
Regions from direct contrast of A/B task versus A/non-A task. In red, A/B > A/non-A; in blue A/non-A > A/B. a, b, Whole-brain cluster corrected contrasts overlaid on a 3D rendering of a canonical brain. a, Left hemisphere. b, Right hemisphere. c–e, Coronal sections illustrating small volume corrected contrast maps in regions of interest. c, Left parahippocampus. d, Left caudate body. e, Right putamen and right caudate head. Statistical maps were overlaid upon a canonical brain in standard MNI space using MRIcro software (www.sph.sc.edu/comd/rorden/mricro.html).

