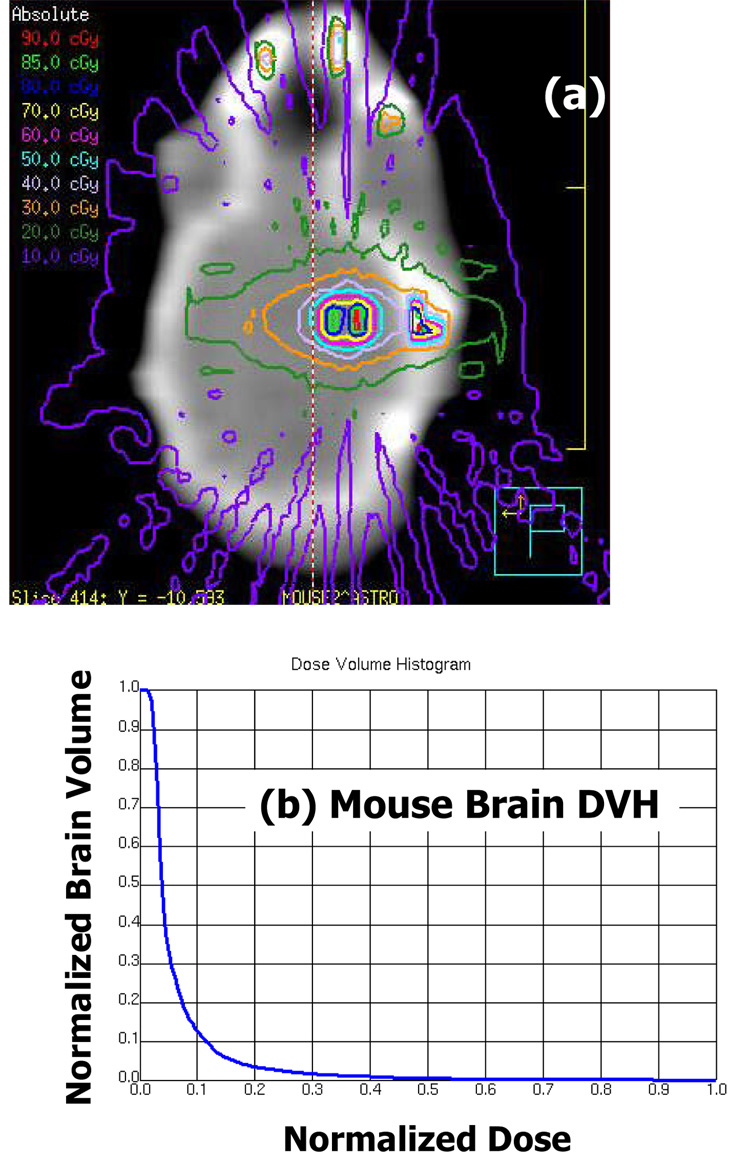
Figure 7.
(a) The EGSnrc generated isodose distributions overlaid on a coronal CT slice of one of the mouse brains irradiated by the fifteen 1 mm diameter beams arrangement as shown in Figure 4. The “dose in air” artifacts are due to non-zero density CT numbers in the calculation grid. The added filtration was 4 mm Al. (b) The corresponding dose volume histogram of the irradiated mouse brain, contoured as the soft tissue density volume encased by the skull.

