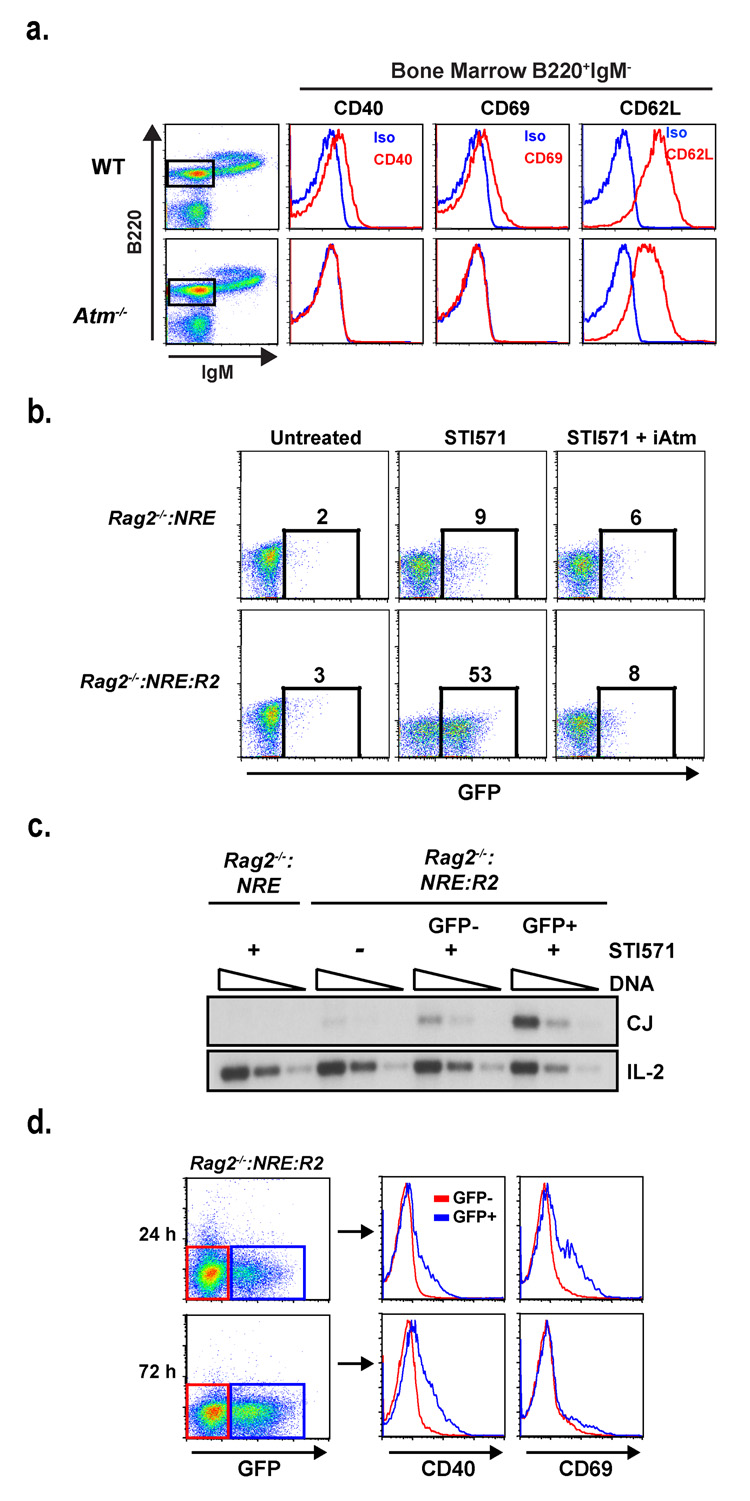
Figure 3. NFκB activation in response to transient Rag DSBs.
(a) Flow cytometric analyses of CD40, CD69 and CD62L expression by B220+:IgM− bone marrow B cells (gated cells in dot plot) from WT and Atm−/− mice. Histograms for the specific antibodies (red) and isotype control (blue) are shown. (b) Flow cytometric analysis of GFP expression in Rag2−/−:NRE and Rag2−/−:NRE:R2 cells treated with STI571 for 48 hours in the presence or absence of the Atm inhibitor KU-55933 (iAtm). The percentage of GFP+ cells is indicated. Results are representative of three experiments. (c) Rag2−/− :NRE and Rag2−/−:NRE:R2 abl pre-B cells were un-treated (−) or treated with STI571 for 48 hours (+) and GFP+ and GFP− Rag2−/−:NRE:R2 abl pre-B cells isolated by flow cytometric cell sorting. Serial 4-fold dilutions of genomic DNA from all cells was assayed for pMX-DELCJ rearrangement by PCR (see Supplementary Fig. 15b). Results are representative of two experiments. (f) Flow cytometric analysis of CD40 and CD69 protein expression on GFP+ (blue histograms) and GFP− (red histograms) Rag-2−/− :NRE:R2 cells treated with STI571 for 24 or 72 hours. Results are representative of two experiments.

