
Figure 3. Differential degradation of torsinA(wt) and torsinA(ΔE) at near physiological expression levels.
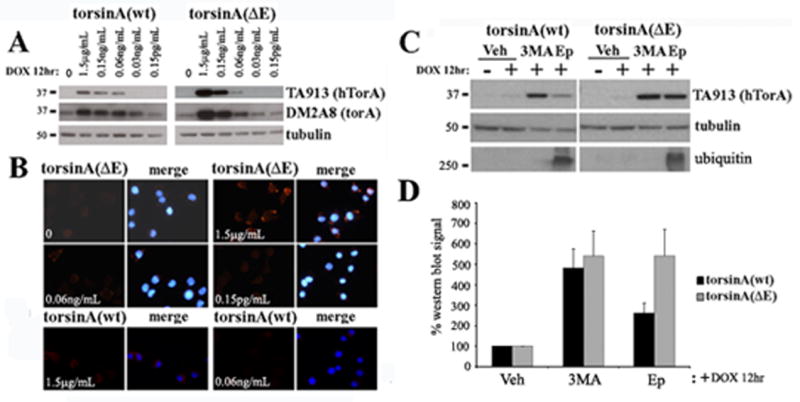
(A) PC6-3 cells were induced with DOX for 12h at the indicated dilutions of the concentration used in the previous experiments shown in figures 1 and 2, and expression levels assessed by western blot analysis. TA913 antibody recognizes only the transgene (human torsinA), while DM2A8 equally detects both the transgene and endogenous rat torsinA. (B) IF analysis after induction at different concentrations to assess spheroid body formation. TorsinA is seen in red and nuclear DAPI staining in blue. (C) Induction at the 1/25,000 dilution for 12 h, followed by a 24 h treatment with the indicated proteolytic inhibitors and western blot analysis of transgene levels. (D) Quantification of 4 experiments as in (C). Vh: vehicle; Epx: epoxomycin; 3MA: 3-methyladenine; hTorA: human torsinA; torA: torsinA.