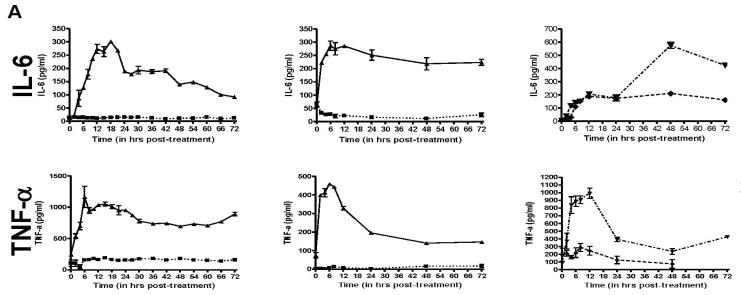
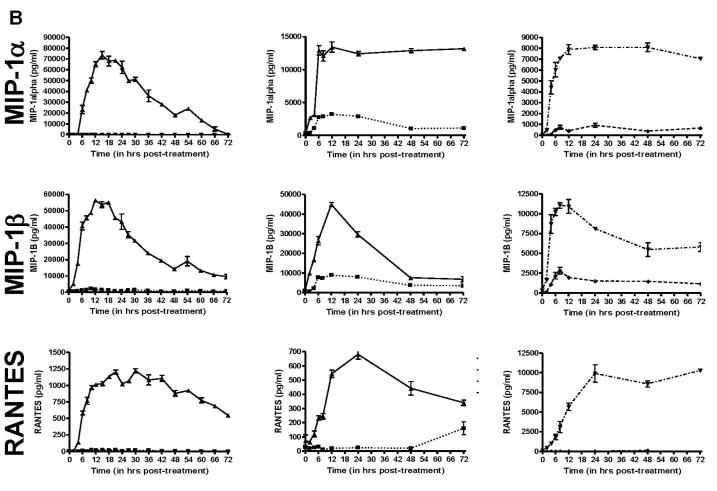
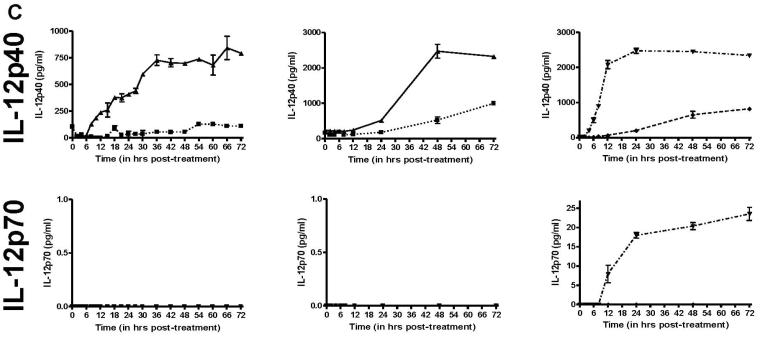
Figure 3. Temporal expression of selected cytokine expression in HHV-8 infected DCs.
A, B, & C. DC were infected with HHV-8 (▲, solid line), untreated (■, dotted line), treated with LPS (◆, dashed line) or trimeric CD40L (▼ ,dot/dash line). Supernatant samples were harvested at selected times post-treatment and analyzed by ELISA for IL-6 and TNF-α (A), MIP-1α, MIP-1β, and RANTES (B) or IL-12p40 and IL-12p70 (C). Each column represents the results from separate DC donors. Error bars represent duplicate samples.


