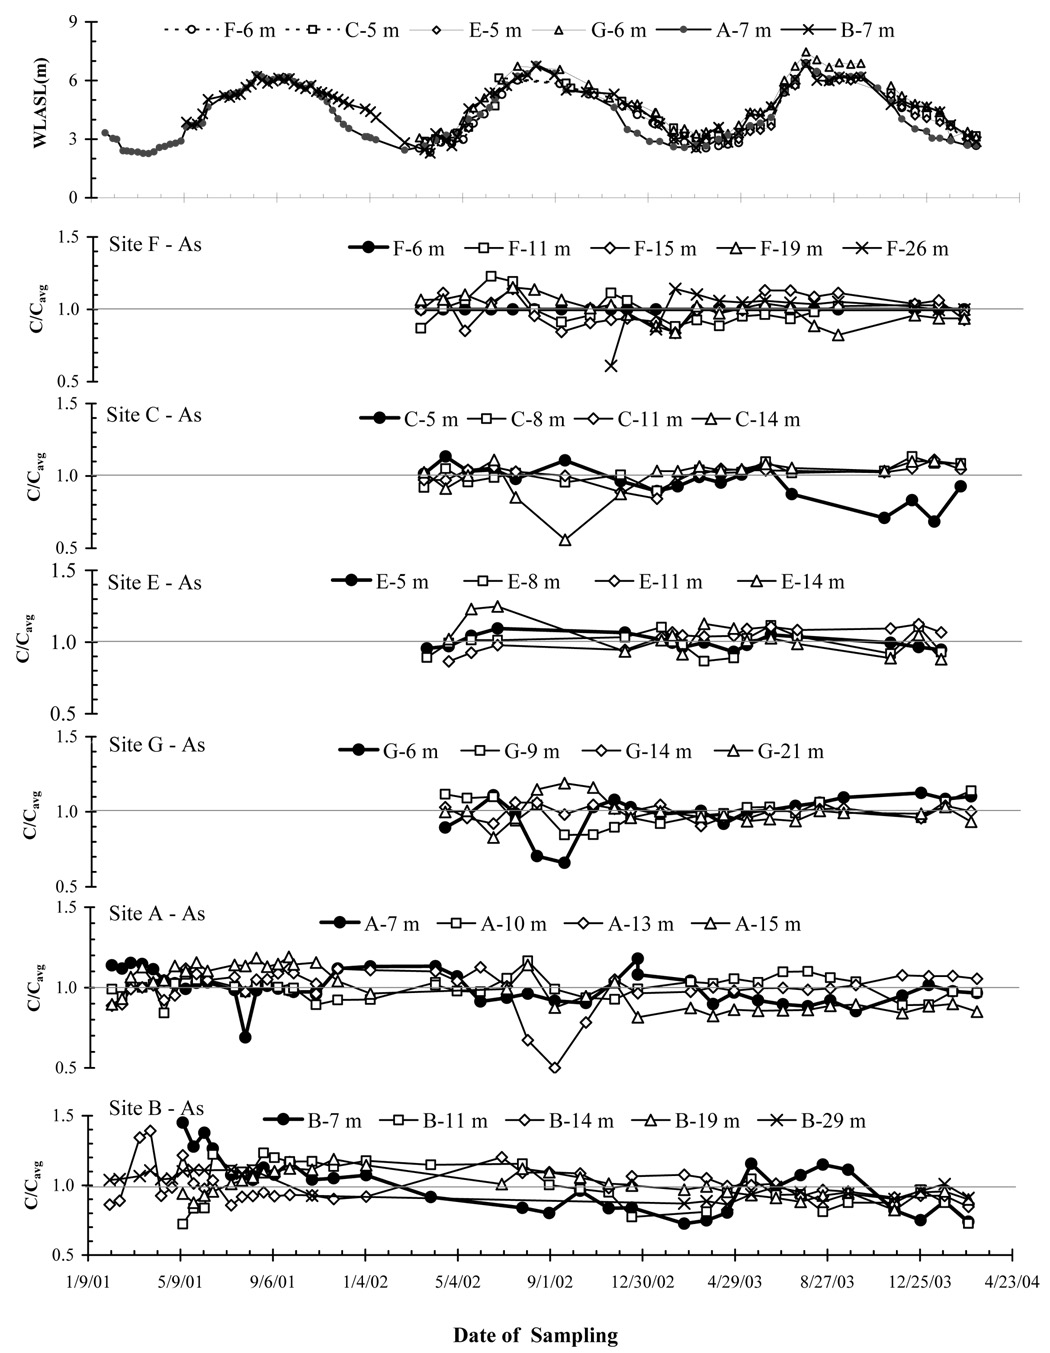
Figure 2.
Water level above sea level (WLASL) spanning the entire monitoring periods from the shallowest well of each site is shown in the upper most panel. The rest of the panels from top to bottom show in sequence, the temporal variability of As concentration in shallow aquifers for Sites F, C, E, G, A, and B. Dissolved As concentrations are plotted as the ratio (C/Cavg) of the concentration at the time of the sampling (C) versus the average concentration of the entire time series (Cavg). In each panel, the bold line always represents the shallowest well of the site.

