
Figure 2. Myocardial injury after OPCAB in the aprotinin vs. control groups.
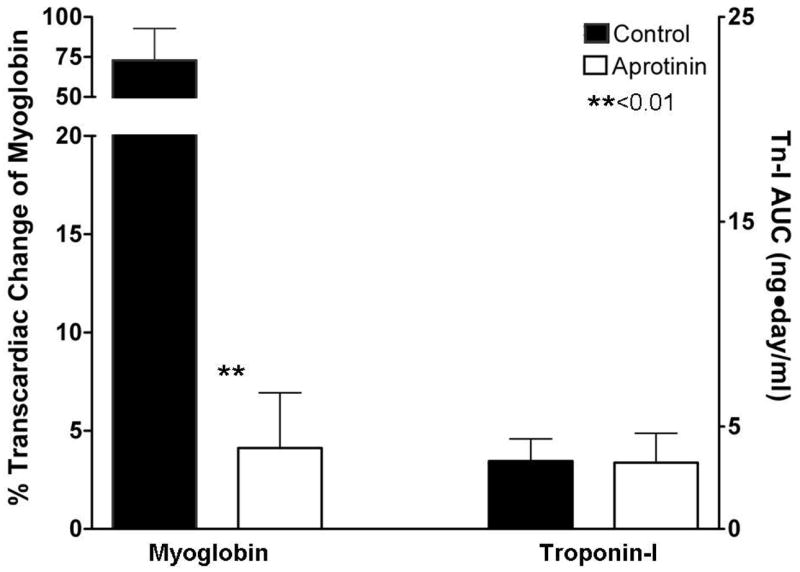
Myocardial injury was measured by analyzing the trancardiac gradient of myoglobin at 30 minutes following the completion of OPCAB and by comparing the area under the concentration-time curve of cardiac troponin I (cTn-I) levels measured at 6, 24 and 72 hours. While transcardiac myoglobin release was significantly reduced in the aprotinin vs. control group, cTn-I was not significantly different.