
Figure 2.
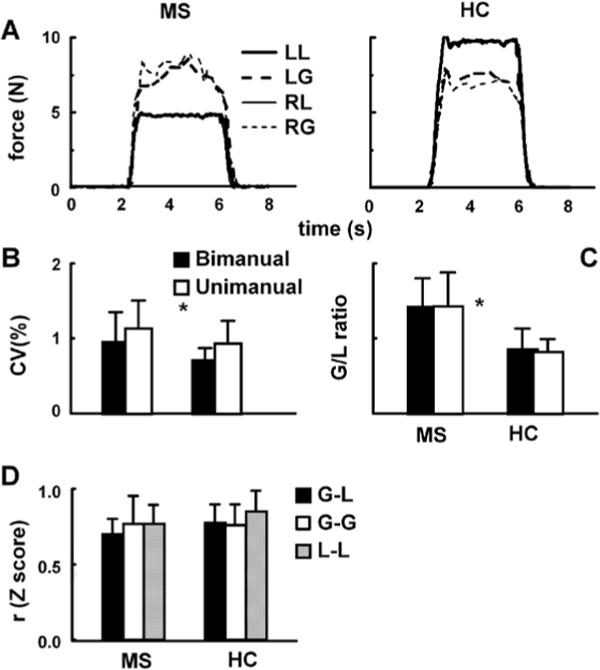
(A) Right (RG) and left grip (LG), and right (RL) and left load force (LL) recorded in the lifting task in a representative MS patient and healthy control. The remaining graphs illustrate coefficients of variation (CV) (B), G/L ratios (C), and Z-transformed correlation coefficients (D) averaged across the subjects. Error bars represent standard deviations.