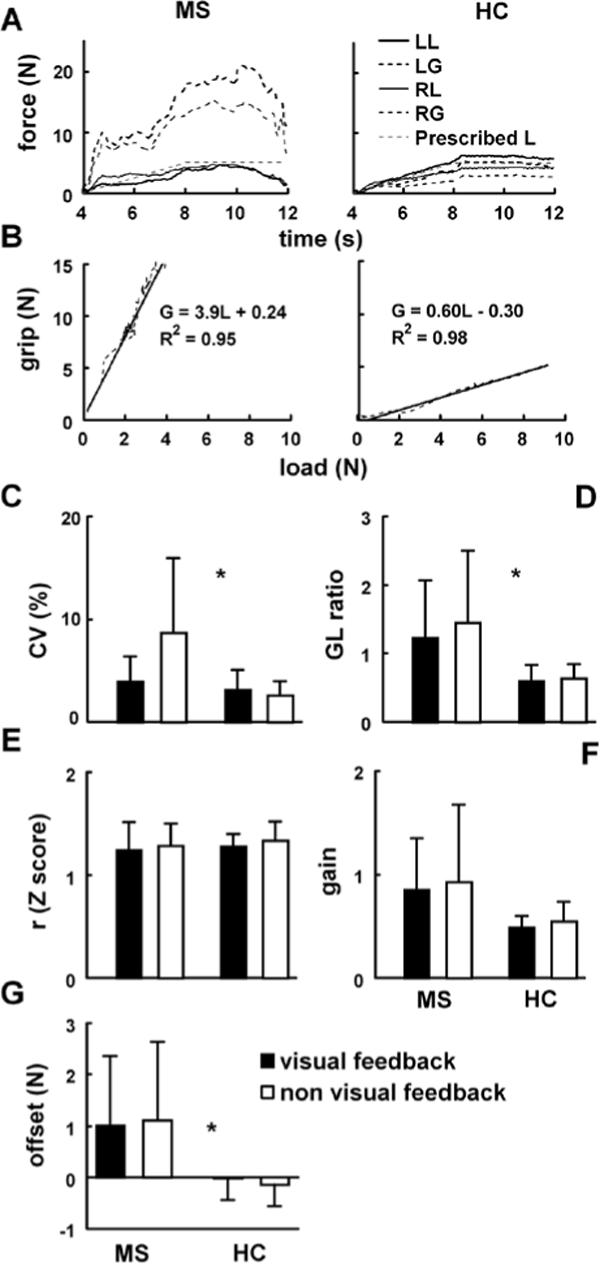
Figure 3.

(A) Right (RG) and left grip (LG), and right (RL) and left load (LL) forces recorded in the ramp-and-hold task in a representative MS patient and a healthy control. (B) Grip-load diagrams represent the data depicted in Figure 3A together with the regression lines and the corresponding coefficients of determination (R2). The remaining graphs illustrate averaged across the subjects coefficients of variation (CV;) C), G/L ratios (D), Z-transformed correlation coefficients (E), and gain (F) and offset (G) that correspond to the slopes and intercepts of the regression lines. Error bars represent standard deviations.
