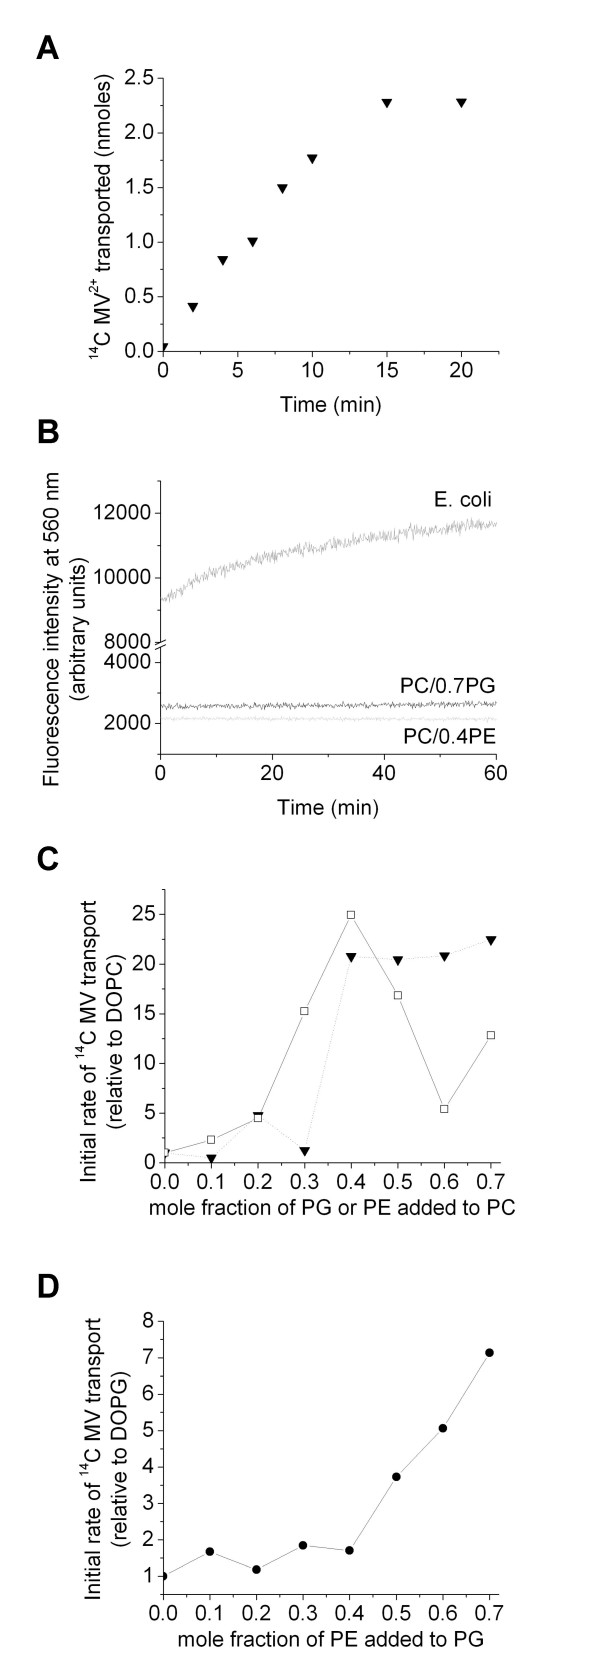
Figure 2.
(a) 14C MV2+transport by EmrE into vesicles of a defined mixture of lipids; DOPC/DOPG with 0.7 mole fraction DOPG. Data are raw transport data, not corrected for the amount of protein associated with the lipid vesicles. (b) Fluorescence intensity over time of the pH sensitive dye, carboxyfluorescein, incorporated inside lipid vesicles, illustrating the maintenance of the pH gradient over time in protein-containing vesicles of varying lipid composition: E. coli lipids (upper dark grey trace); DOPC/DOPG with 0.7 mole fraction DOPG (middle black trace) and DOPC/DOPE lipid vesicles with 0.4 mole fraction DOPE (lower light grey trace). The fluorescence intensities in the lower two traces only increase by ~5% over 60 mins, which is within the noise of the data. A ~30% increase in fluorescence intensity occurs in the upper E. coli trace over 60 mins (~9% over 10 mins). (c) Initial rate of 14C MV2+ transported by EmrE as a function of lipid composition in DOPC lipid vesicles. (□), DOPC/DOPE (▼), DOPC/DOPG. These initial rates are determined from the linear region of the MV transport data and additionally corrected for the amount of protein associated with the lipid vesicles. Thus, the point (▼) at 0.7 for DOPC/DOPG is determined from figure 2a. Data points are joined for clarification. (d) Initial rate of 14C MV2+ transported by EmrE as a function of DOPE mole fraction in DOPG/DOPE lipid vesicles. All assays were carried out with 42 μM 14C MV2+. Data in figures 2c and d are initial rate data, corrected for the amount of protein, thus are per mg of EmrE. For comparison, they are shown relative to the rate in DOPC lipid vesicles in (b) or the rate in DOPG in (c) (i.e. with the relative rate for DOPC or DOPG being 1). Data in (a) are the average of for triplicate measurements for one protein sample (see methods), with the errors being smaller than the data points. Data in b and c are determined by linear fits to the initial rate data, as for example in (a); the errors from these fits are also smaller than the data points.

