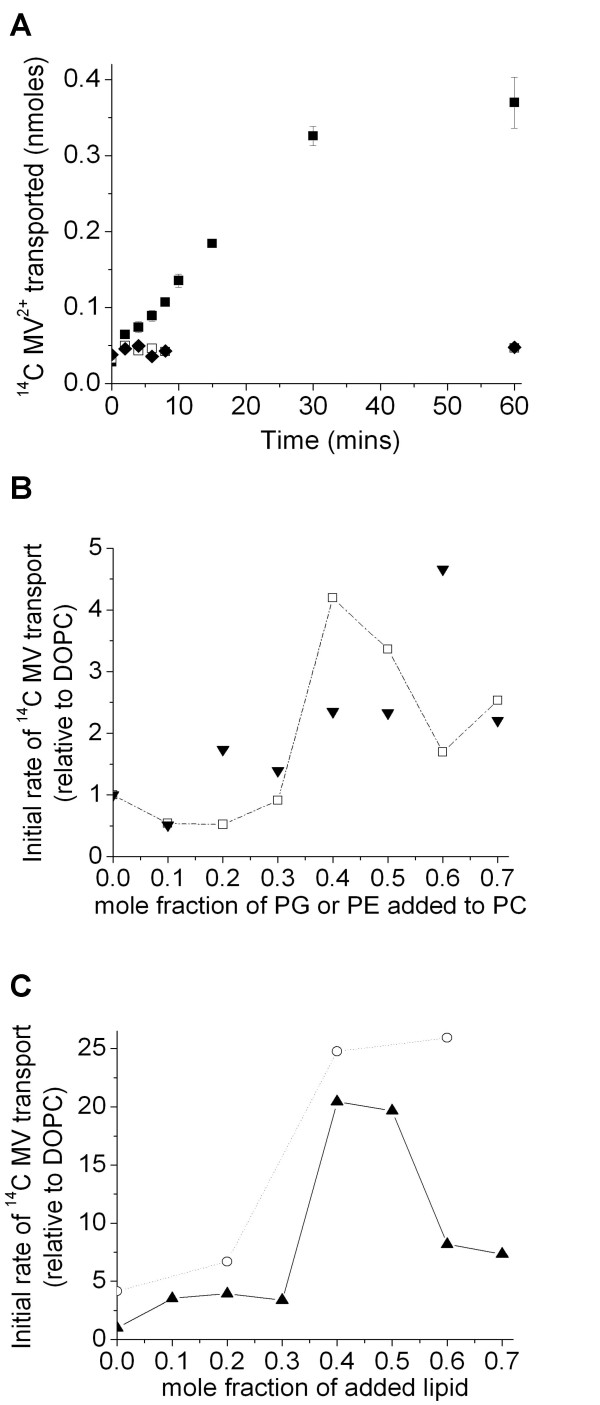
Figure 3.
MV transport by TBsmr. (a) 14C MV2+ transport into (■) 50 nm extruded E. coli lipid vesicles over time; control data with (□) no TBsmr present; (◆), no pH gradient. Initial rate of 14C MV transport as a function of lipid composition into (b) (□), DOPC/DOPE; (▼), DOPC/DOPG and (c) (▲) DOPC/soyPI; (○), soyPI/DOPE (the second lipid in each case is the mole fraction on the x axis). Data points are joined to clarify trends. Data in figures 3b and 3c are initial rate data, corrected for the amount of protein (thus are per mg of TBsmr) and shown relative to the rate in DOPC lipid vesicles. There is a larger pH gradient than for EmrE (pH 9 on the outside of the liposome for TBsmr, but pH 8 for EmrE and pH 7 inside for both proteins). As for EmrE, 42 μM 14C MV2+ was used in the TBsmr measurements.

