Fig. 5.
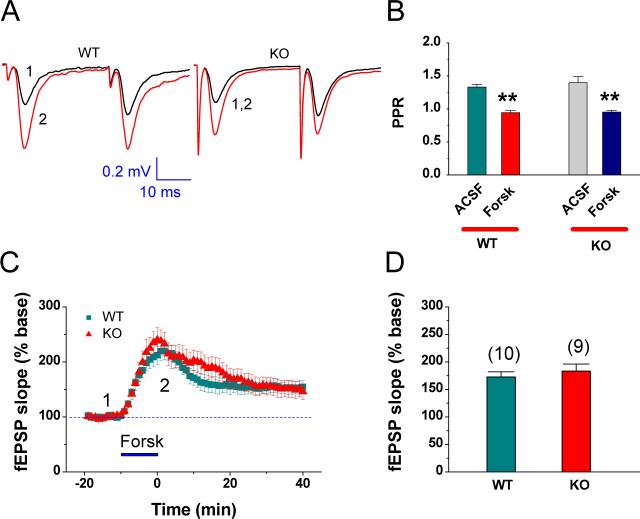
Downstream signaling pathway of the EP2 is still intact in EP2 KO mice. (A) Representative traces of fEPSP recorded before (black) and after forskolin (Forsk, red) in the dentate gyrus in EP2 WT and KO mice. (A2) Mean values of paired-pulse ratio (PPR) averaged from 6−10 min following bath application of Forsk (5 μM). (B) Time courses of Forsk-induced changes in fEPSP slopes in EP2 WT and KO mice. (C) Mean values of the changes in slope of fEPSPs averaged from 10 min during bath application of Forsk in slices from EP2 WT and KO mice. **P< 0.01 compared with vehicle control.

