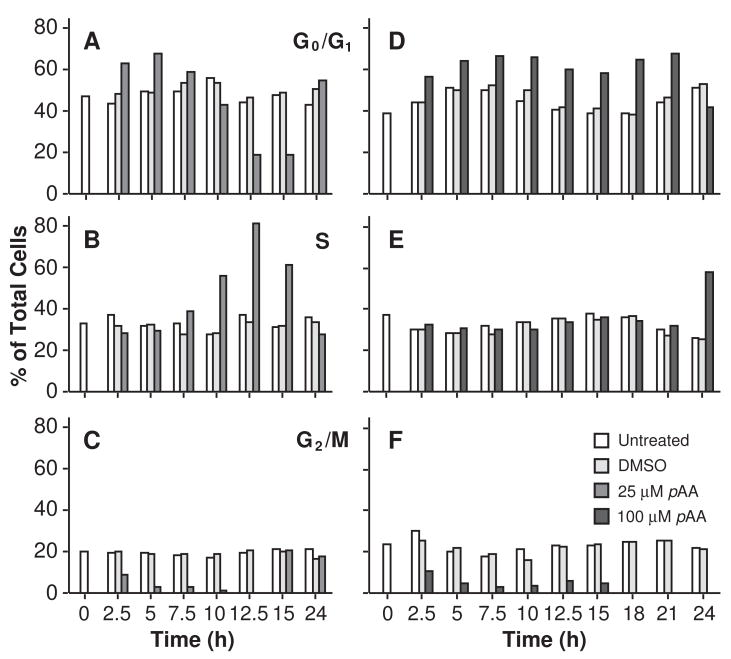
Fig. 2.
Effects of pAA on cell cycle progression. MCF10A cultures were either left untreated, or exposed to DMSO, or 25 μM (A,B,C) or 100 μM (D,E,F) pAA prior to being harvested. Cell cycle distribution was evaluated using propidium iodide staining of DNA, which was analyzed by flow cytometry. Data similar to that reported in the figure were obtained in a second independent experiment. Bars are defined in the figure.

