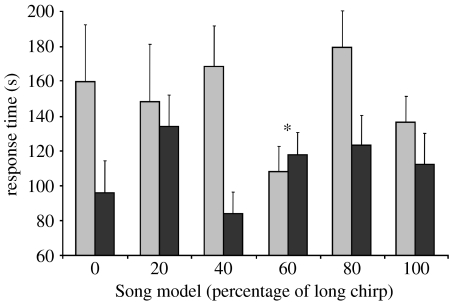
Figure 2.
Female response latencies. Females exposed to song (Song) during rearing are represented by grey bars, and those reared in silence (No Song) by black bars. Response latency directly reflects the amount of time a female takes to reach an acoustic stimulus starting from the time it is perceived; females with shorter response latencies are interpreted to be more responsive. The asterisk highlights the 60 per cent long-chirp song model that has been shown to be the most preferred song model in population-wide preference tests (Bailey 2008). Bars indicate 1 s.e.

