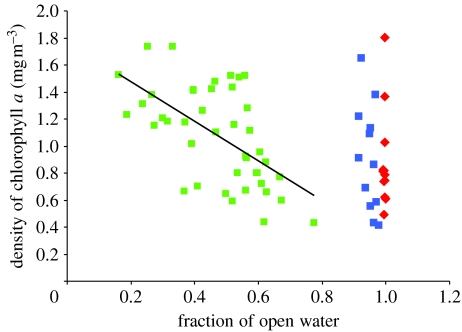
Figure 4.
Spring-time primary production in NW (green squares, i.e. Qaanaaq, Upernavik, Uummannaq and Disko), CW (red diamonds, i.e. Maniitsoq and Nuuk) and SW (blue squares, i.e. Paamiut and Qaqortoq) relative to the fraction of open water. The values shown are weekly chlorophyll a densities at bird colonies each year between 2001 and 2003. A linear regression is fit for NW (y=−1.4694x+1.7726, R2=0.3508).

