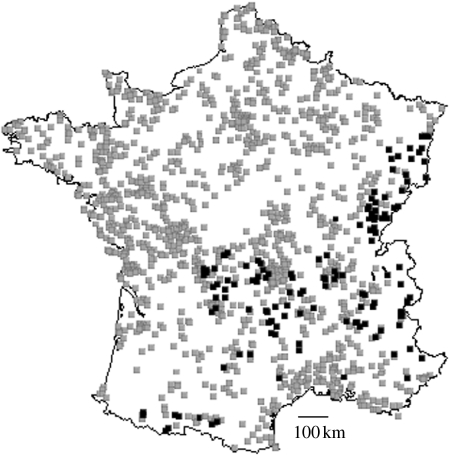
Figure 1.
Spatial distribution of breeding bird survey plots. Each grey plot is a 2×2 km square (surveyed at least 2 years during 1989–2006 in which 10 point counts were evenly distributed). The CTI was calculated on each point count during the surveyed period. To estimate the south–north gradient in CTI, squares located above 800 m (in black) were excluded.

