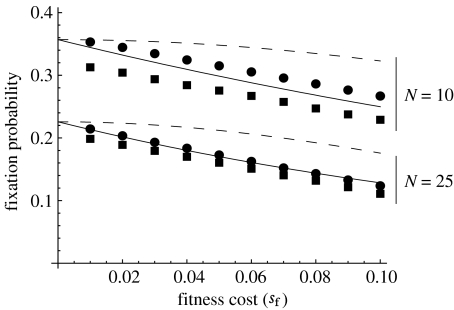
Figure 4.
Examples of the performance of the diffusion approximations of fixation probability when population size is small (N=10 or 25). The solid lines are the new approximations (equation (3.1)) and the dashed lines the approximations of Rigaud & Rousset (1996, our equation (1.2)). The squares are the results of simulations in Egas et al. (2002) and the circles those from simulations we have carried out. We assumed sh=1 and μ=0.

