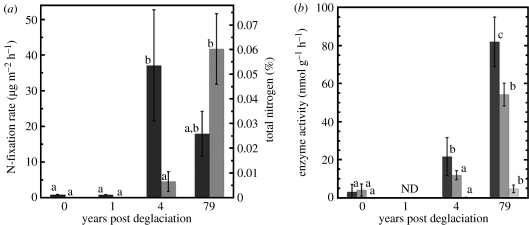
Figure 3.
(a) Means±1 s.e. of N-fixation rates (n=8 per soil age; black bars) and total soil N (n=4 per soil age; grey bars) in soils of varying ages along the chronosequence. Different letters on bars of the same variable indicate significant differences (p<0.05) determined from one-way ANOVA and Tukey's post hoc analysis. (b) Microbial enzyme activities (black bars, phosphatase; grey bars, peptidase; light grey bar, cellulase) in soils of varying ages along the chronosequence. Data shown are means±1 s.e. and differing lower-case letters represent significant differences (p<0.05) in enzyme activity at different points along the chronosequence.

