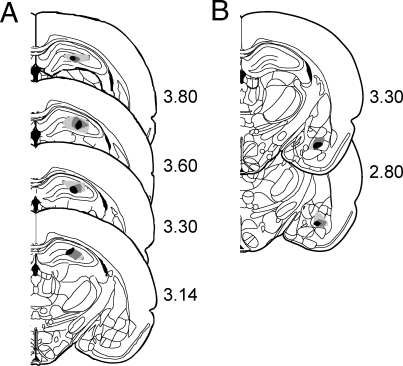
Figure 5. Characterization of the Infusion Sites in the (A) DH and (B) BLA.
Infusion sites from a subset of the animals are plotted on schematics of the brain at the indicated distance in millimeters posterior to bregma. The one third of the injection sites closest to the centroid location at each level fell within the black region. Two thirds fell within the medium-gray region, and all injections fell within the light-gray region.

