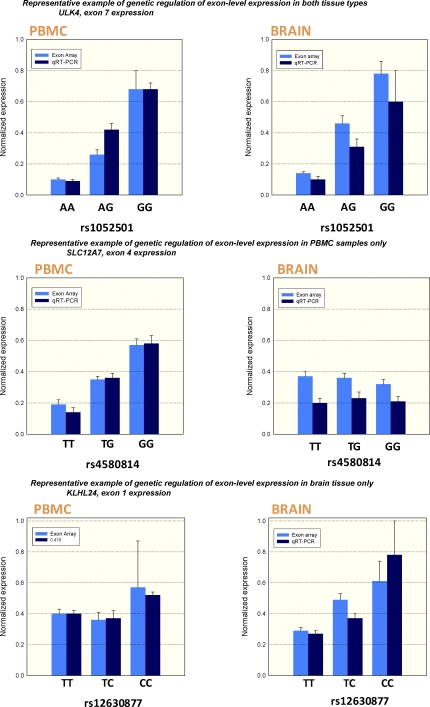
Figure 3. Quantitative Real-Time PCR Confirmation of Selected Genetically Regulated Exon-Level Expression Changes in the Two Tissue Types.
Three representative scenarios are presented. The top panel shows an sQTL that was present in both brain and PBMCs. The middle panel and bottom panel show sQTLs unique to a particular tissue type, providing unequivocal evidence for tissue specific genetic regulation.

