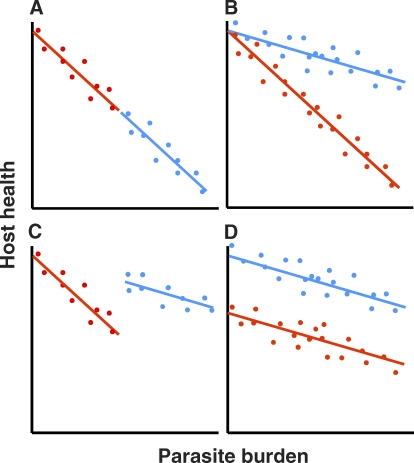
Figure 1. How to Statistically Separate Resistance and Tolerance Components of Host Health.
Dots represent individual hosts from one of two genotypes (red or blue) challenged with a fixed dose of a microparasite. (A) Both genotypes are similarly tolerant but differ in resistance, with the red genotype able to better reduce burdens and thus maintain a higher health status.
(B) Host genotypes are equally resistant (similar mean burdens) but differ in tolerance, with red the less tolerant genotype because health declines more rapidly within increasing parasite burden.
(C) Host genotypes differ in both tolerance and resistance; here, the more tolerant genotype (blue) is less resistant so that both genotypes have, on average, the same health status.
(D) Host genotypes differ in neither resistance (they have the same mean burden) nor tolerance (they both have the same rate of decline in health as burdens increase). Their health differences arise from “general vigour,” because it is apparent even when no infection is present (intercept on the y-axis). This contrasts with the situation in (A), where the impact of increasing burdens on health is the same for both genotypes, and both are predicted to have the same health in the absence of infection. Reproduced from [9].

