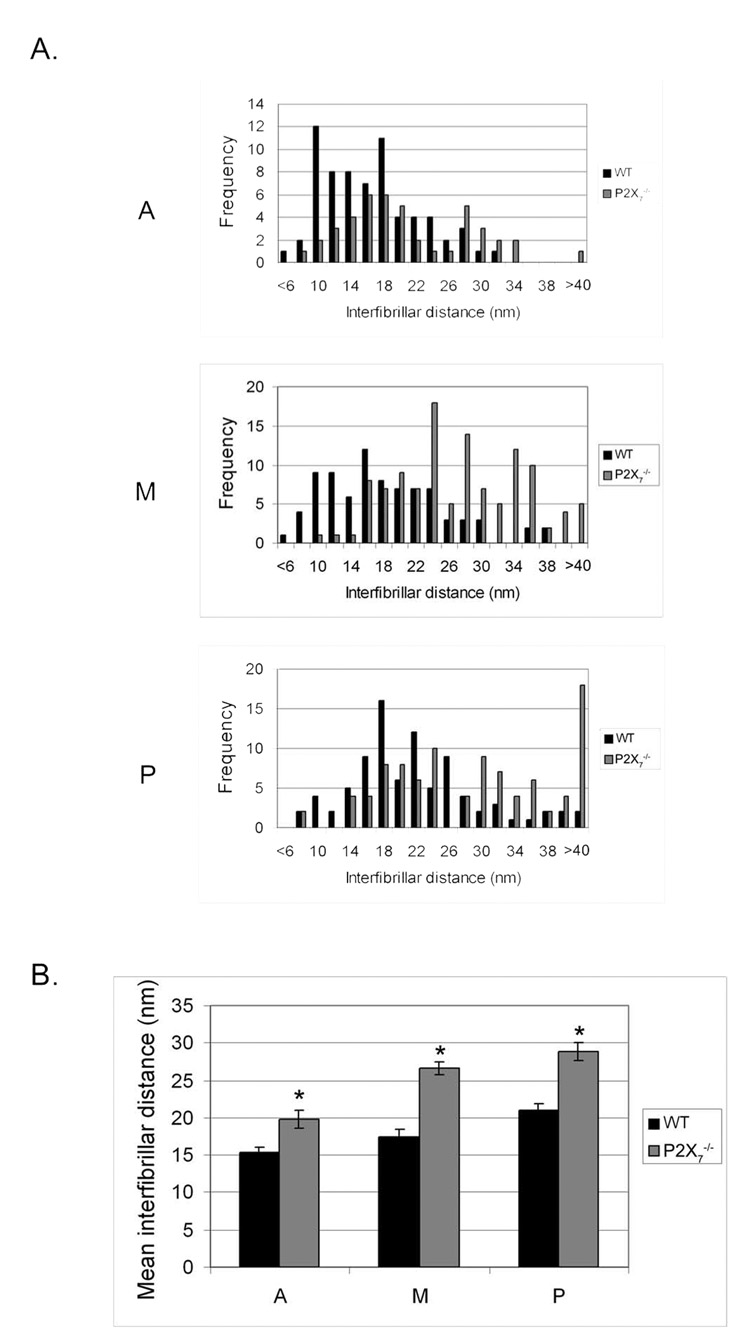
FIGURE 7.
Interfibrillar distance in unwounded WT and P2X7 −/− stromas. Interfibrillar distance in each nonoverlapping region was measured. (A) Frequency of interfibrillar distance. (B) Mean ± SEM interfibrillar distance of each region is graphed. A, anterior; M, middle; P, posterior. At least 40 measurements were performed for each group. *P < 0.001; t-test.

