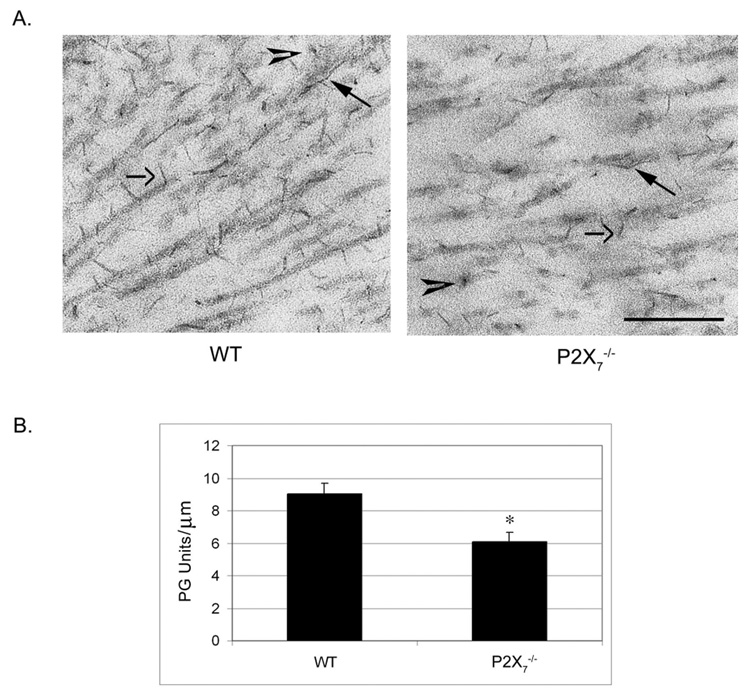
FIGURE 9.
Electron micrographs of unwounded, central stromas stained with cuprolinic blue. Tissue was stained with cuprolinic blue before it was processed for electron microscopy. (A) Micrographs of middle stroma. Closed arrows: PGs associated with collagen fibrils. Open arrows: elongated filaments running along fibrils. Arrowheads: elongated filaments seen in cross-section. Scale bar, 250 nm. (B) PU/collagen fibril ratio in WT and P2X7 −/− stromas. The length of collagen fibrils was measured, and the number of PG units along that length was counted. PG per micrometer is graphed ± SEM. At last 22 measurements were performed for each group. *P < 0.001; t-test.

